
Lab: Creating Interactive Dashboards in Tableau
To help you tell the data analysis story for the sales performance of a retail chain, you'll need to create an interactive dashboard that you can present to stakeholders and other interested parties.
Data:
Use the Tableau workbook called yourname_workbook that you saved in Lesson 1.
Required software:
You can complete this lab using the free, downloadable Tableau Desktop (Public Edition) desktop software. You may also use the free Tableau Public online platform, but some tasks may not work in exactly the same way or may not be supported in that version.
Although we are using Tableau for this hands-on lab, you can use other data visualization tools to perform these tasks such as IBM Cognos Analytics or Google Looker Studio.
Duration: Estimated time 30 minutes
Tasks:
1. Create a new dashboard
- In the yourname_workbook create a new blank dashboard
- Name your dashboard Performance Analysis
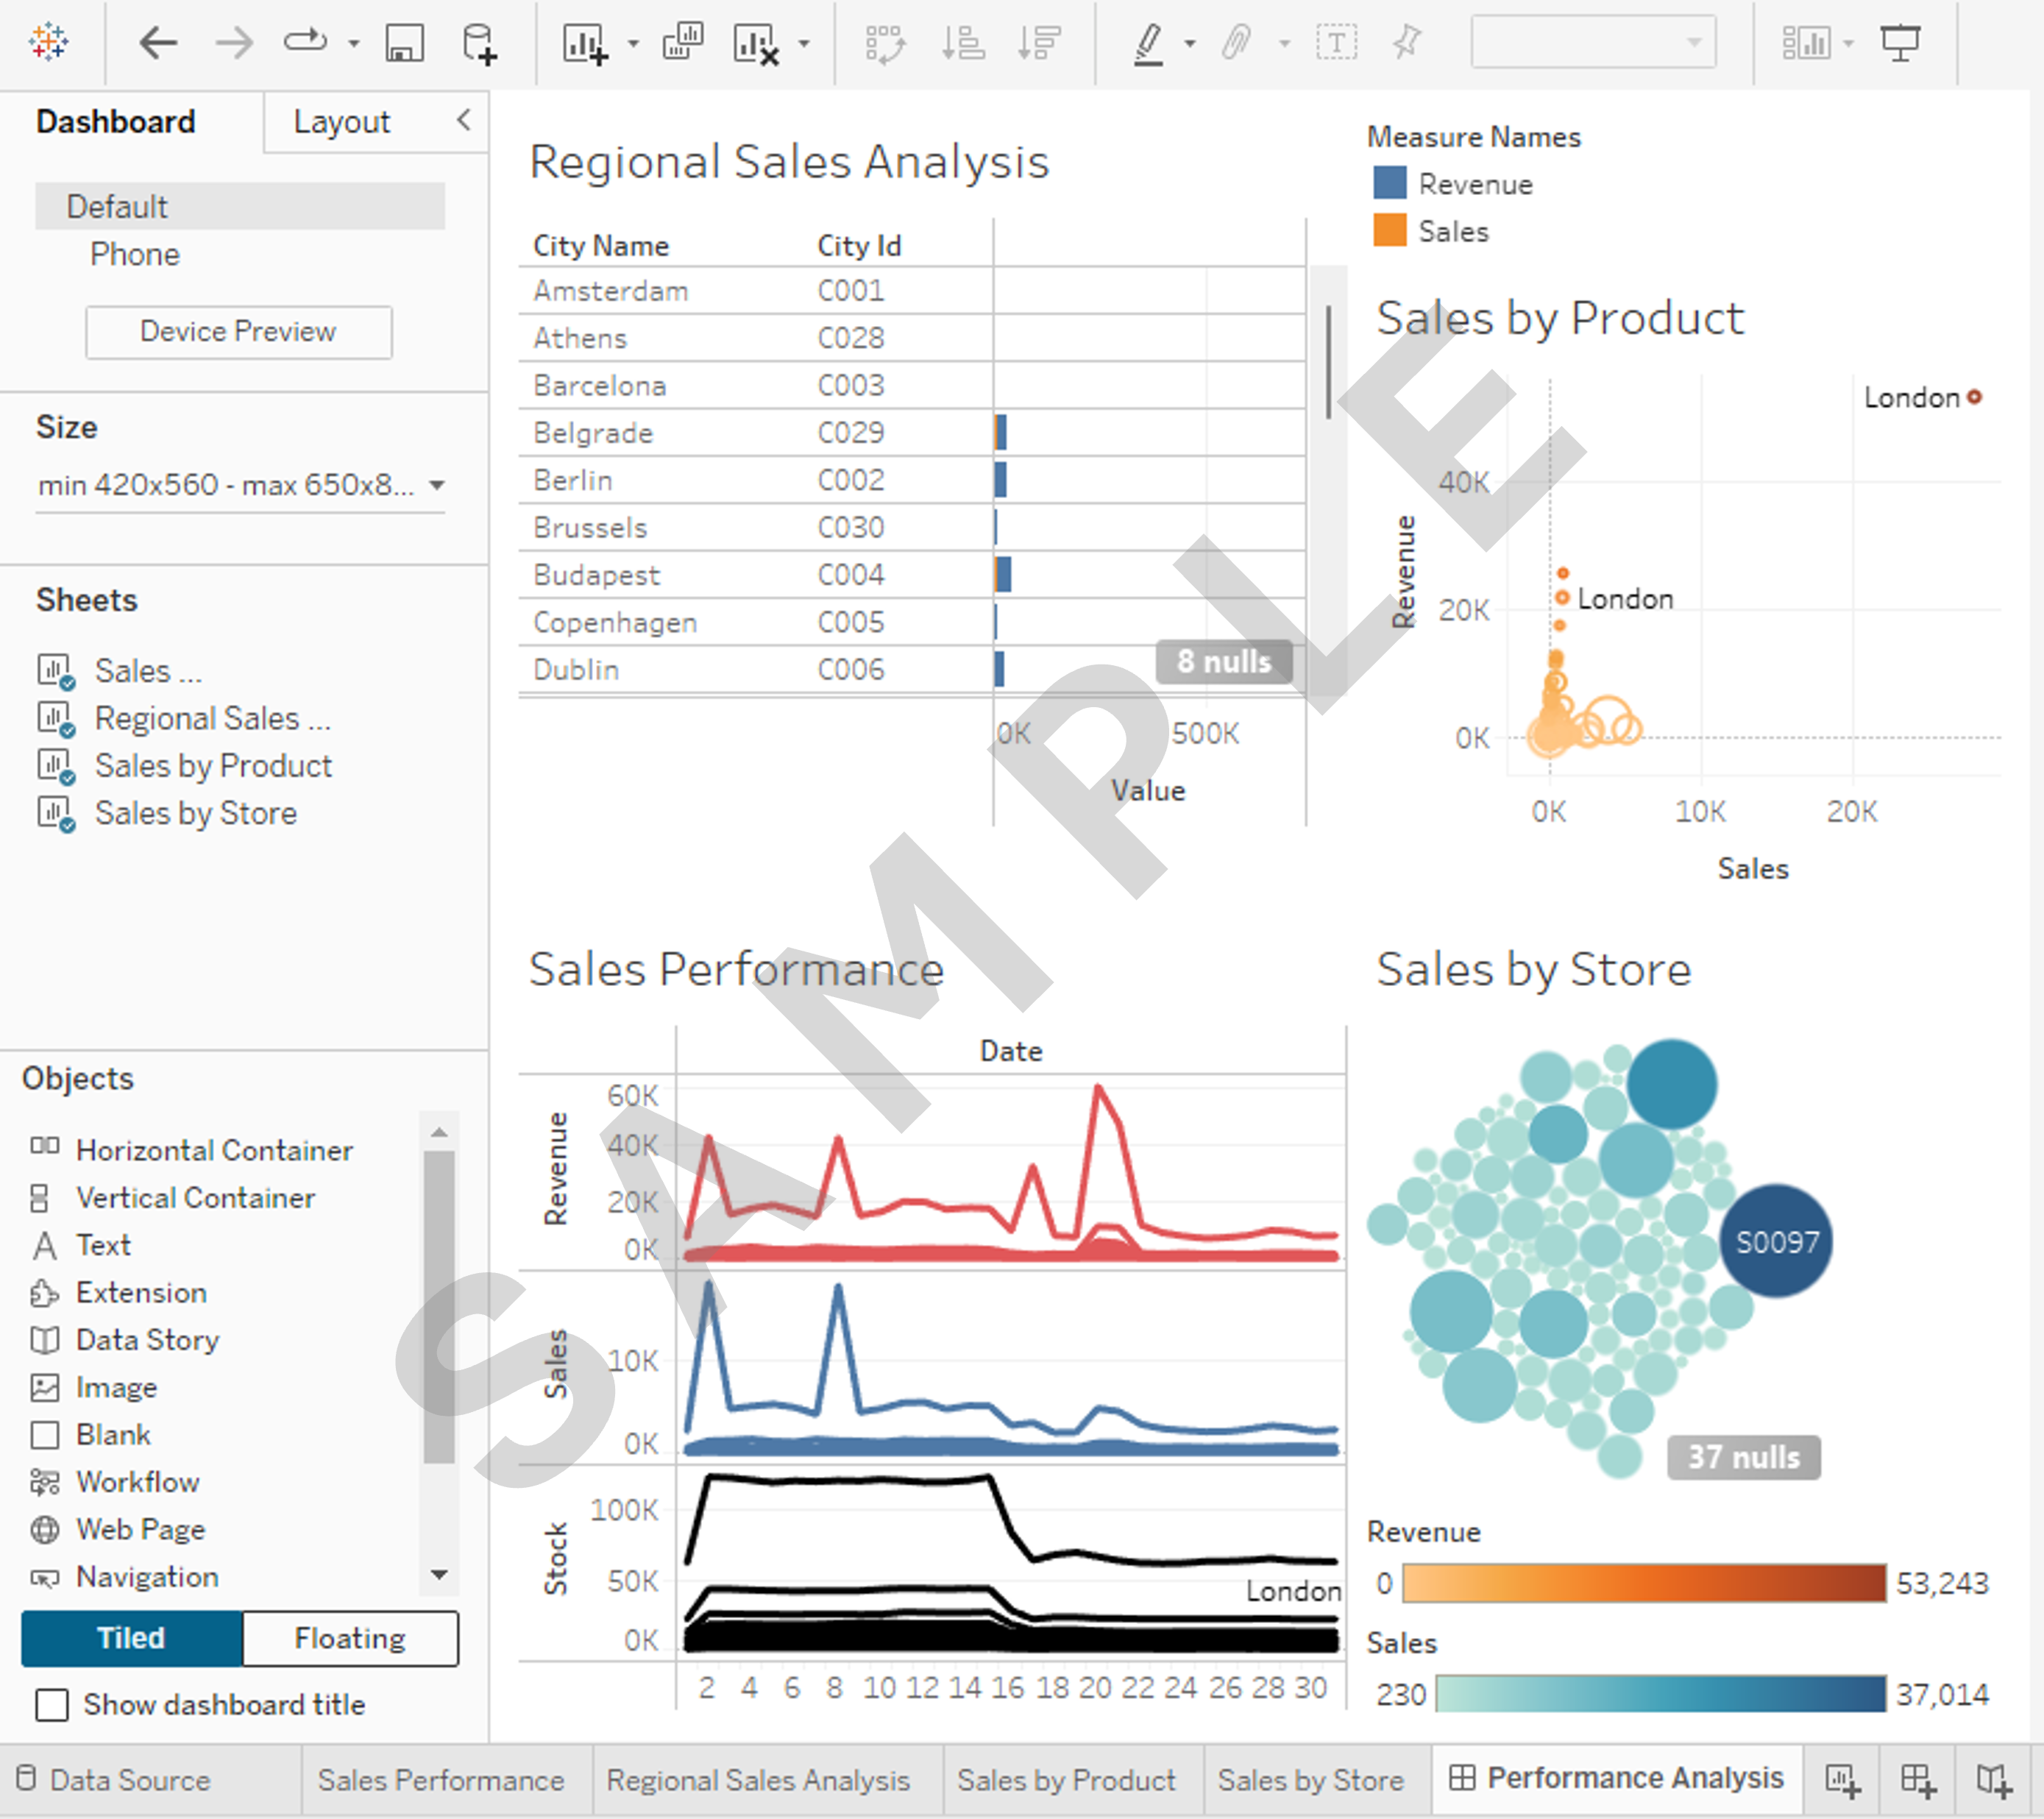
2. Add multiple worksheets to the dashboard
- Add all four worksheets that you created in the Lesson 1 lab to the dashboard
- Adjust the dashboard layout using containers
- Take a screenshot
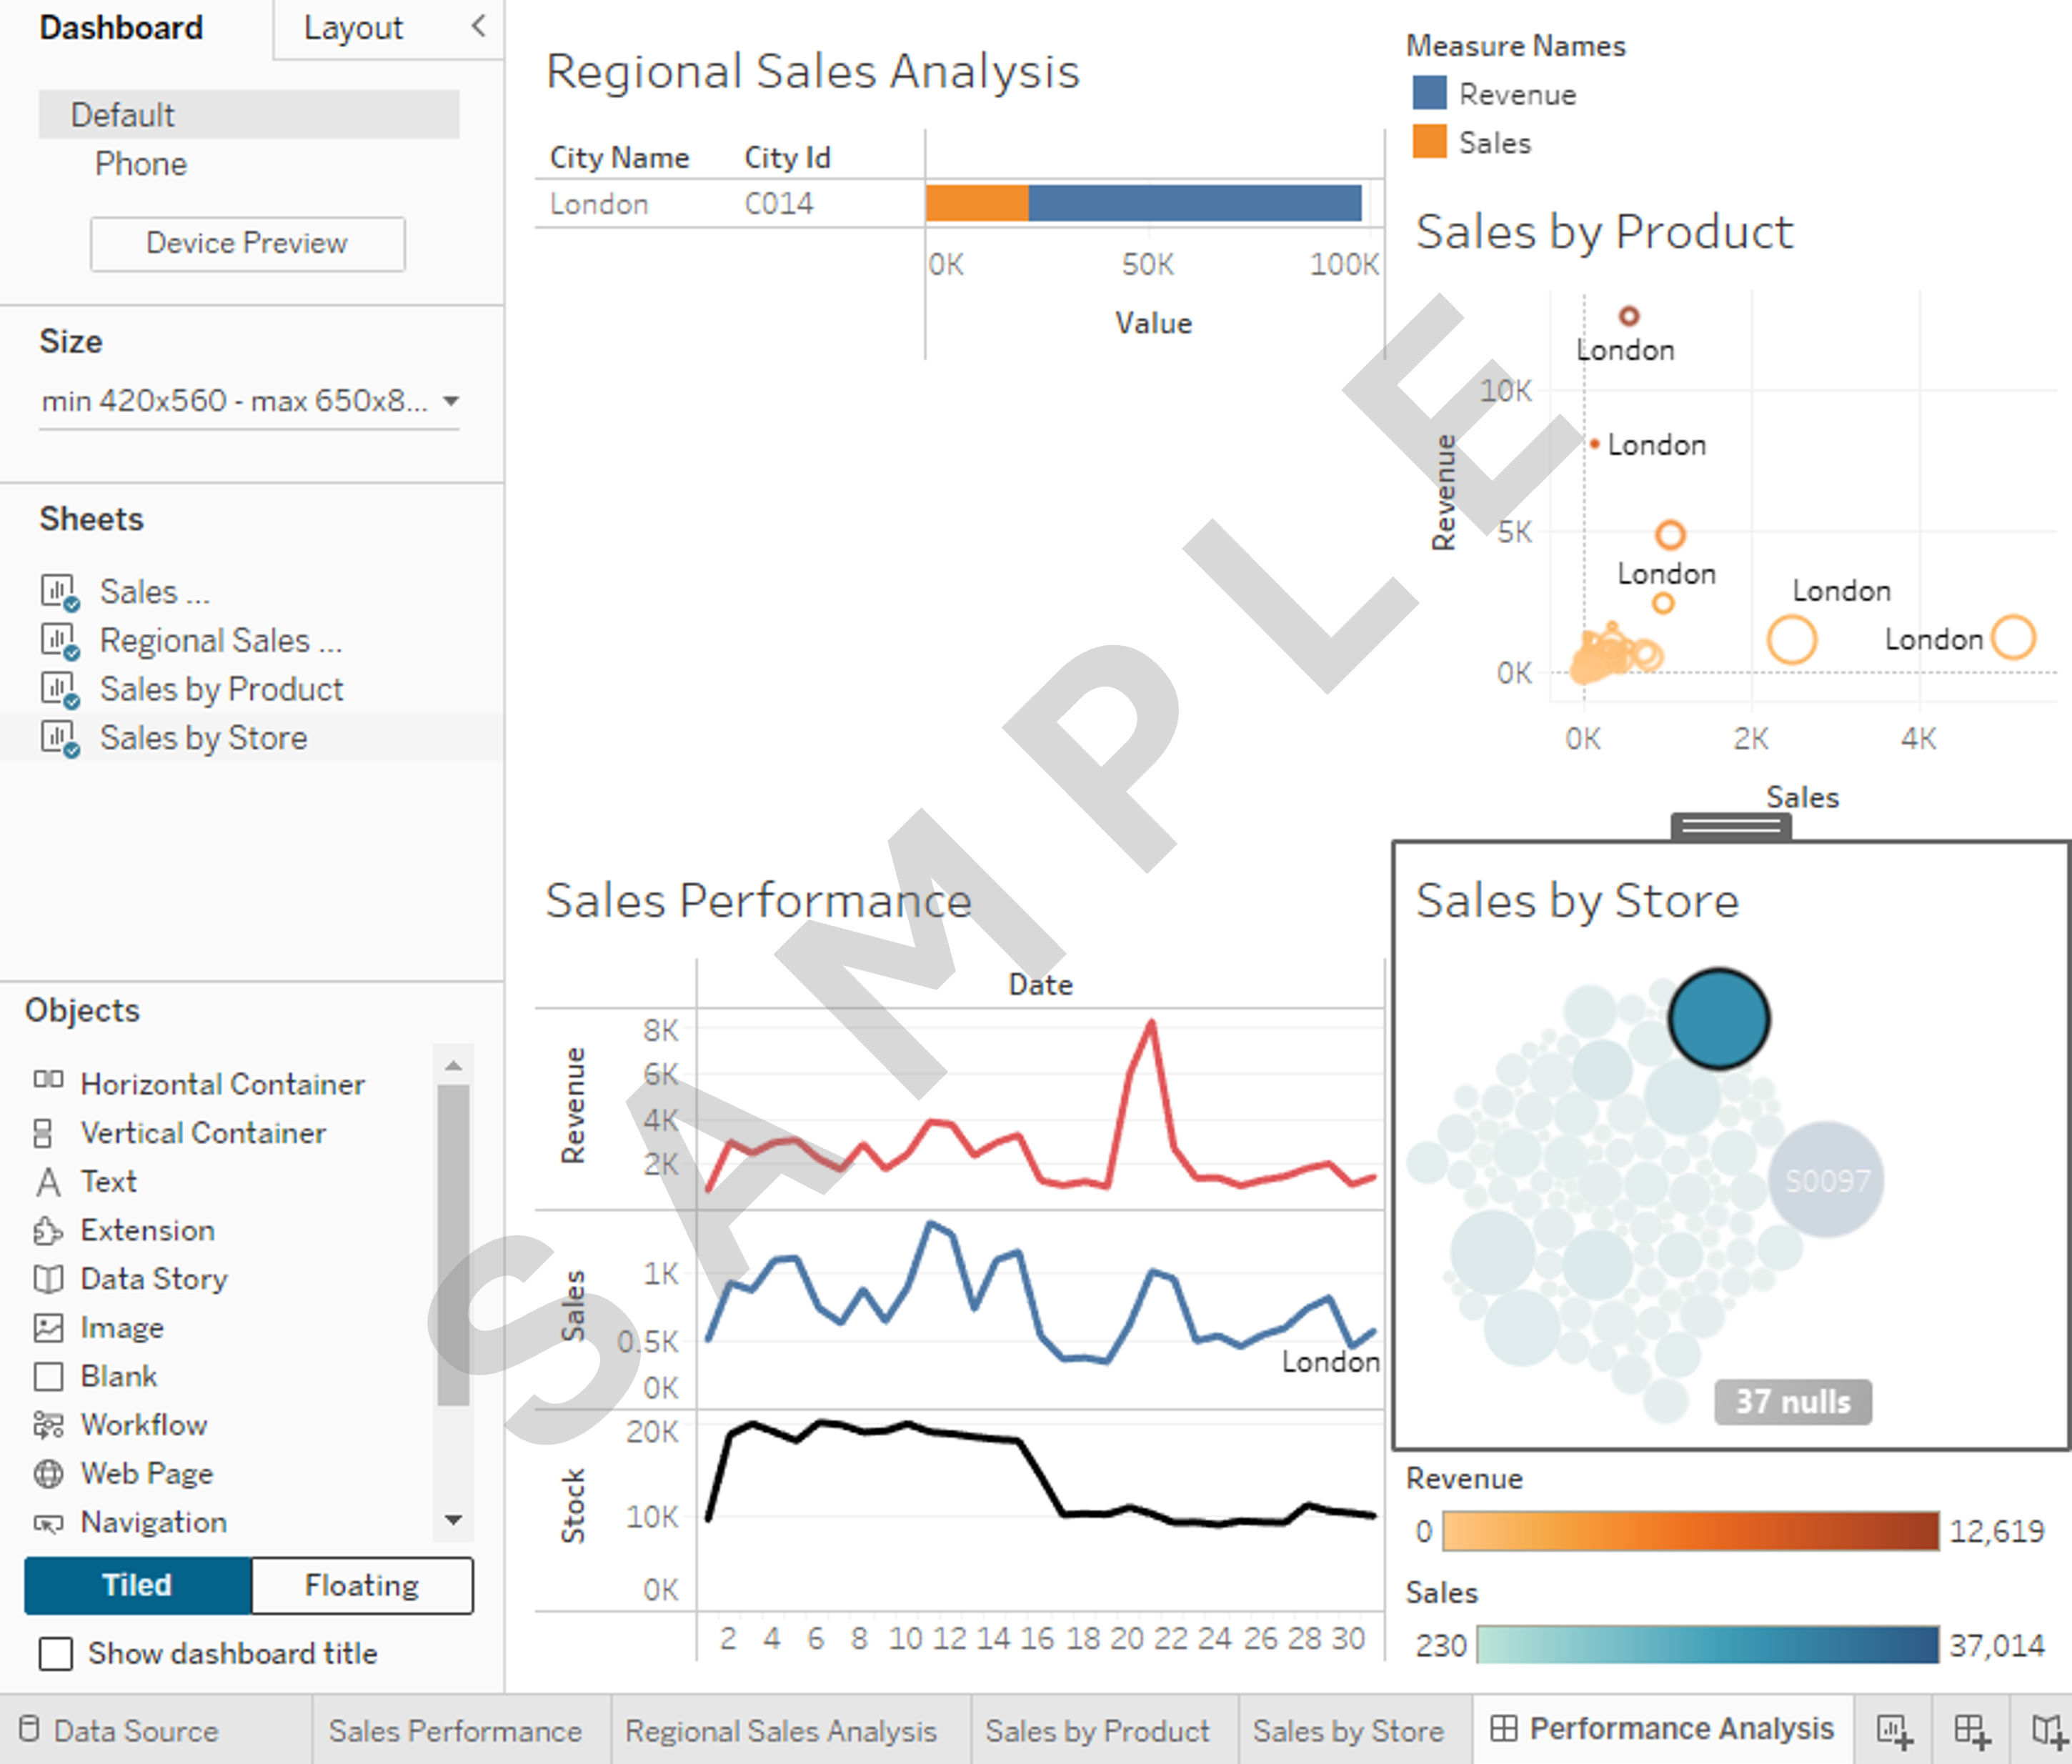
3. Add dashboard actions for interactivity
- Add a Dashboard Action that uses a Filter to display each store's related analysis in the other three visualizations when a user clicks any store name in the packed bubbles chart in the Sales by Store visualization
Hint
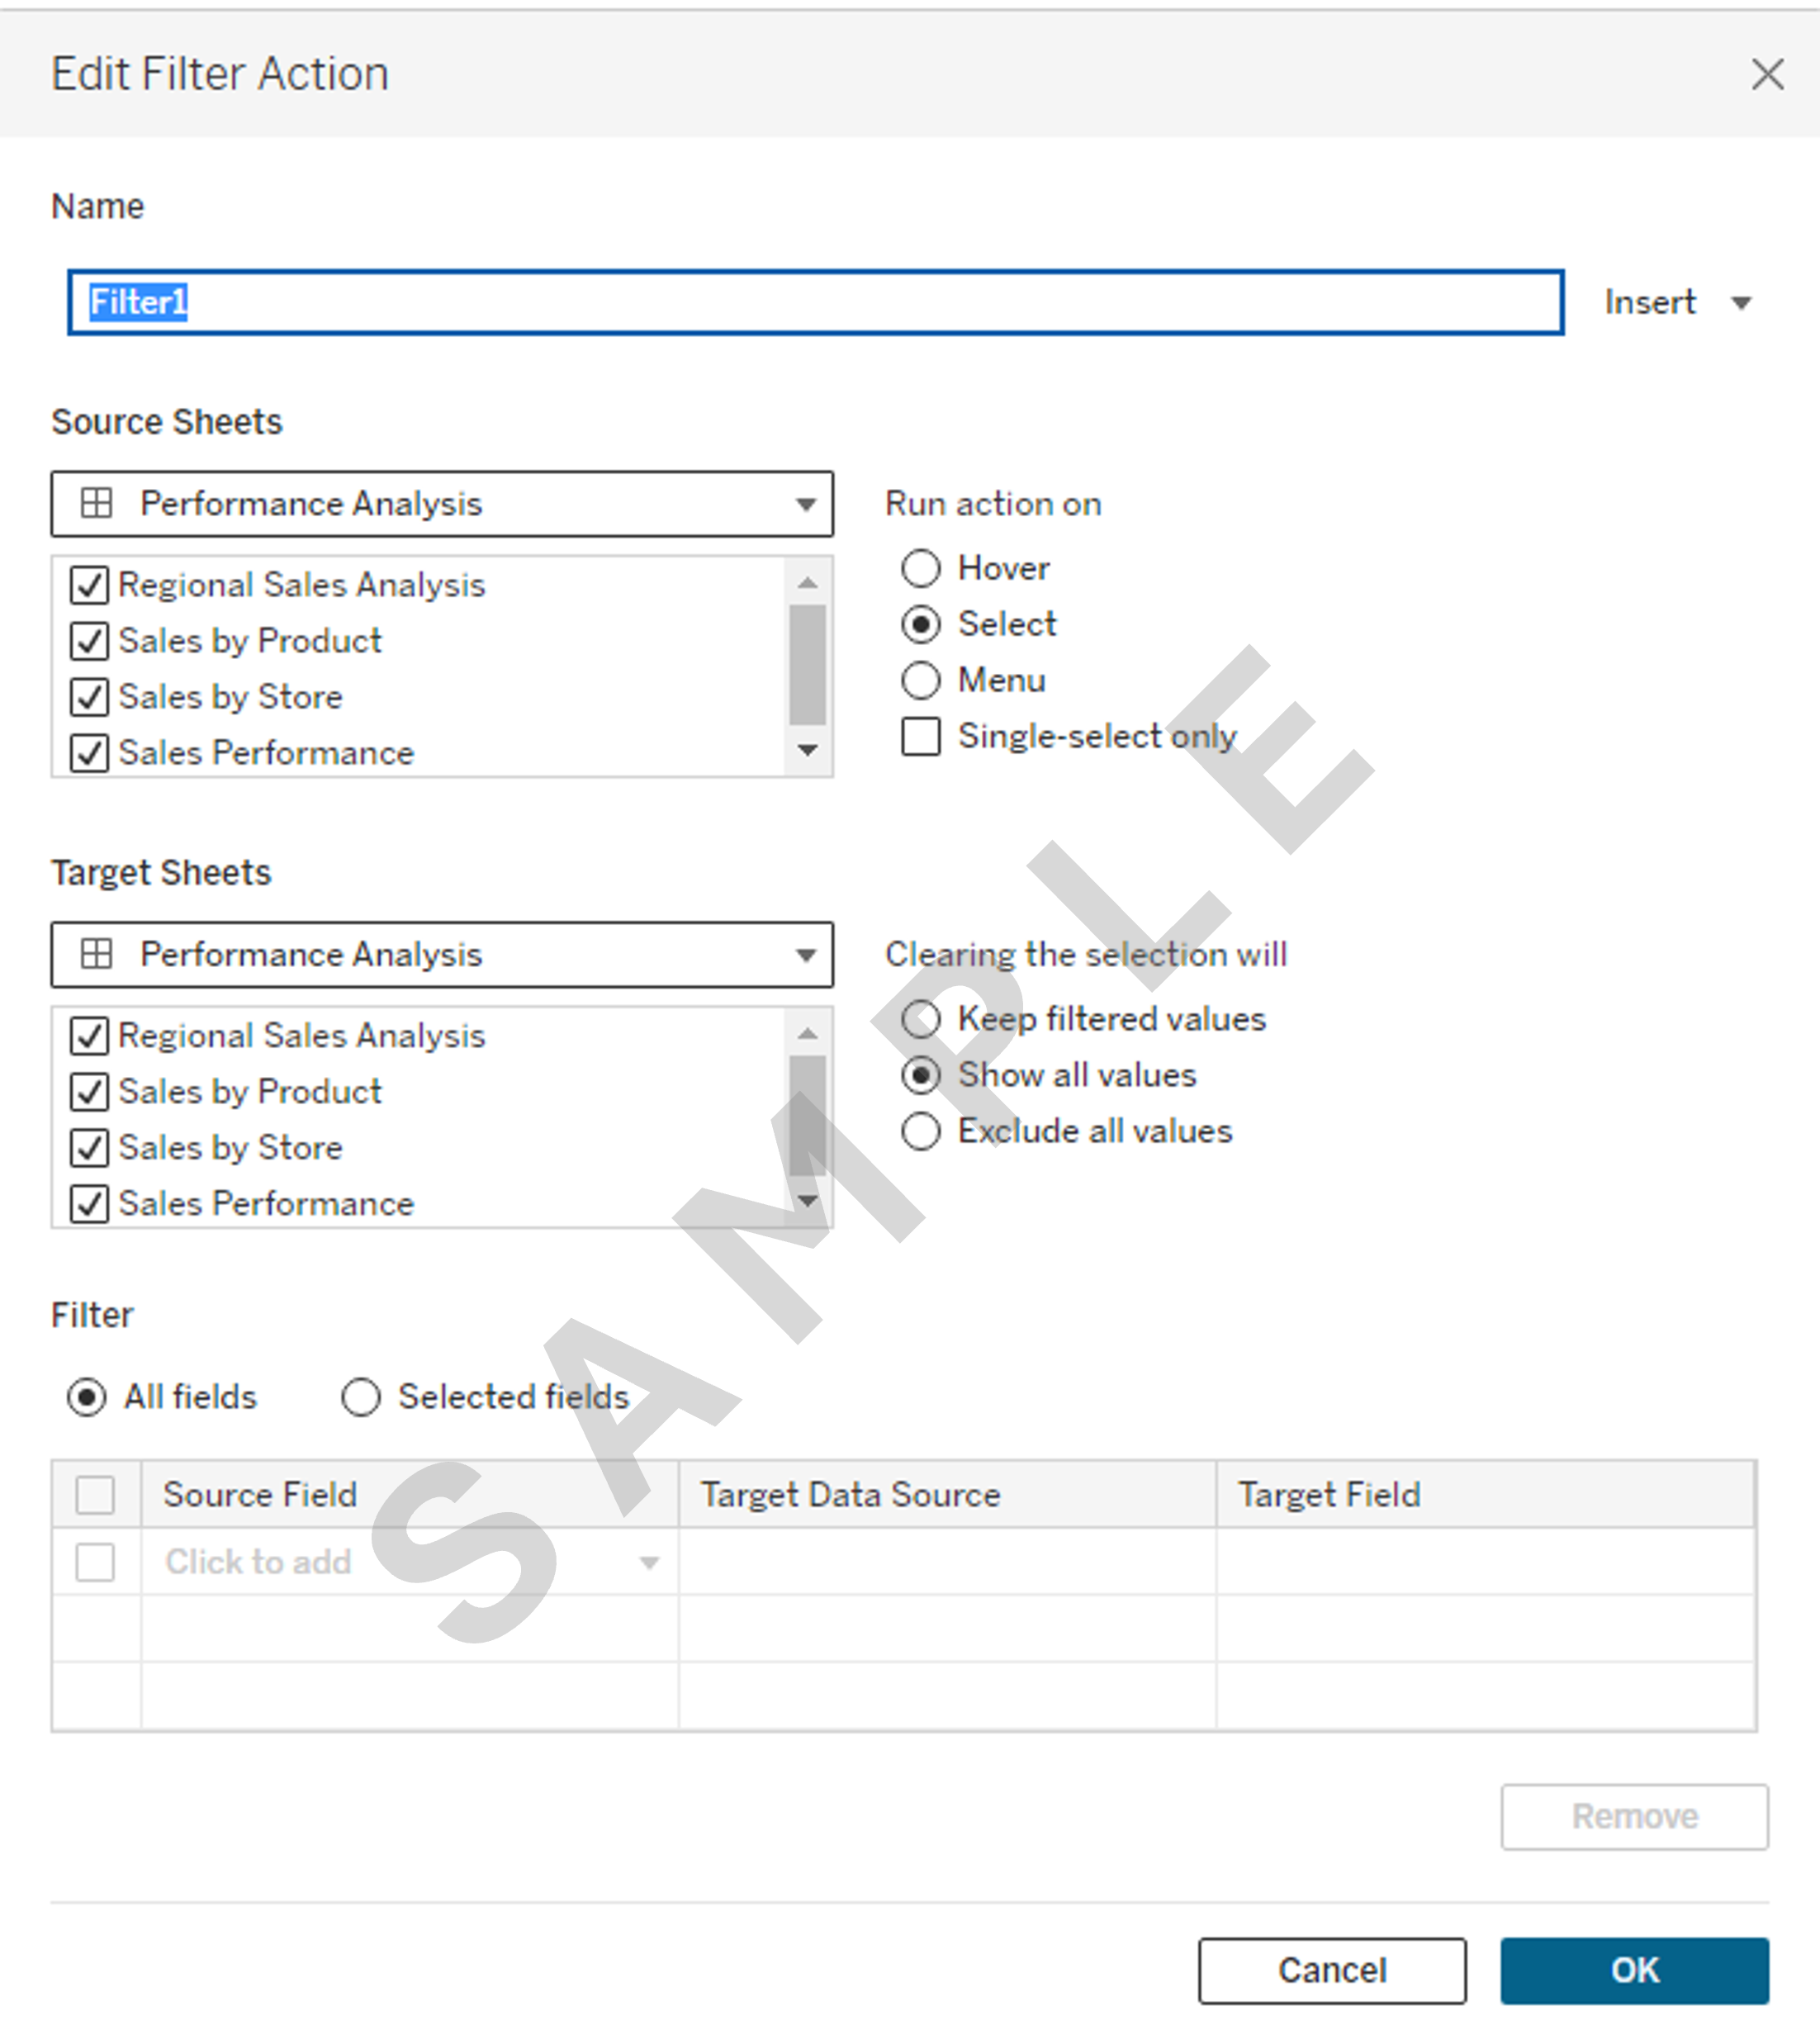
- Take a screenshot
4. Save your workbook and take a screenshot of your dashboard
- Save your Tableau workbook as yourname_workbook.
- Take a screenshot of your final dashboard, as you'll be required to add it to your final PowerPoint presentation
Note
Upon finishing the tasks outlined, you will have constructed a comprehensive dashboard in Tableau comprising multiple worksheets that showcase a variety of data visualizations. You should add each relevant worksheet into the dashboard to be interactive and interconnected. Make sure to capture screenshots for the final dashboard, as you'll be required to add them to your final PowerPoint presentation.
Congratulations! You have completed this lab and are ready for the next topic.
Author(s)
Steve Ryan